Tanks
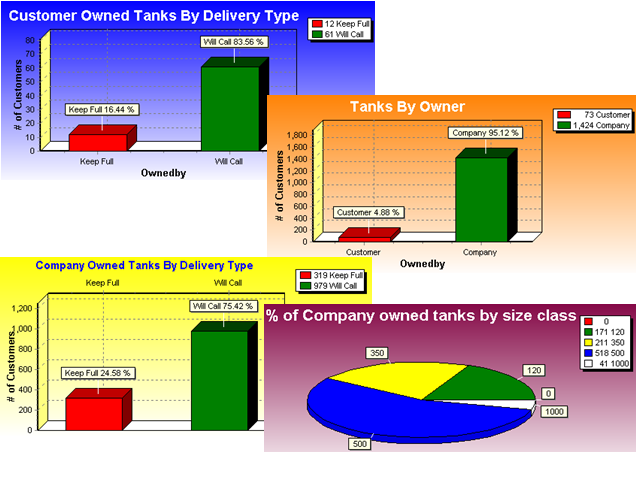
Lynx Propane Software has many tools to help you track your tanks and give you information about how these expensive assets are being used - graphs, for example. Lynx Propane Software's graphs are data driven and update themselves when you put in or take out tanks or change specific data fields that drive these graphs.
A good example of the propane specific detail put into the entire system is the Delivery frequency report. The following is a screen shot of the Delivery frequency report in preview form. The Delivery frequency report can be ordered by gallons delivered or by the number of deliveries made. This report can be run to find tanks that are not being delivered to or tanks that are having to many deliveries made to them. Special care was taken to make sure that the right tanks show up on this and all tank reports. For example, many times a landlord will lease a tank but never buy any fuel. The tenant buys the fuel on a separate account. A special landlord/tenant relationship is set up in Lynx Propane Software to insure that tanks being used in this way don't show up as tanks that are not being used.
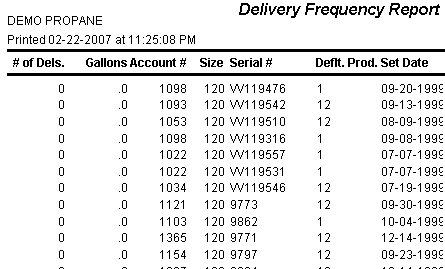
The delivery frequency report is just one of 13 different tank reports. Each report is filterable by many fields and most can be ordered in different ways. The combination of the order by feature and filtering make the tank report possibilities almost unlimited. All reports have a preview and all tank reports print out on 8.5 x 11 inch paper.
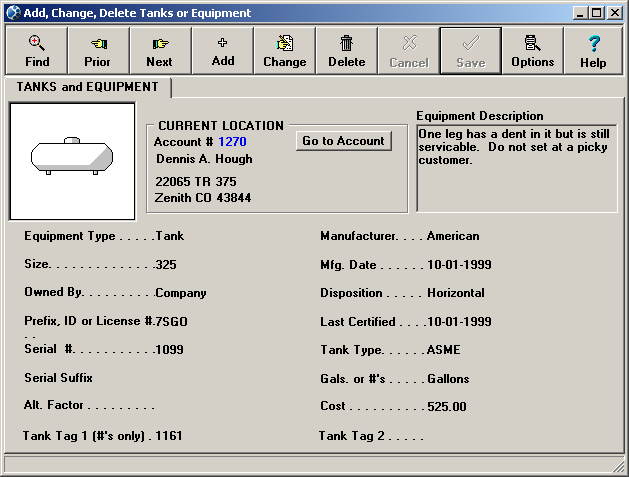
The following screen is where tanks and equipment are viewed, added or changed. This part of the system can also be used for any type of equipment that you want to keep track of. Any type of tank or equipment can also be rented and automatically billed through Lynx Propane Software.